Mastering the data labeling tool.
Deep Block allows you to label your datasets easily. This annotated data is then used to train machine learning models to automatically perform the same task.
Overview
What is data labeling?
Data labeling in computer vision is the process of annotating or labeling images to provide additional information about the contents of the data. This information is used to train computer vision models to perform various tasks, such as object detection, segmentation, and classification, among others.
In data labeling, the data is usually annotated manually by humans, who draw bounding boxes around objects in an image, label the objects with a class name, or draw segmentation masks to outline the object boundaries.
Data labeling is a crucial step in developing computer vision models as it provides the model with the necessary information to learn and make accurate predictions. The quality of the annotated data can significantly impact the performance of the trained models, so it is important to ensure that the data labeling is done accurately and consistently.
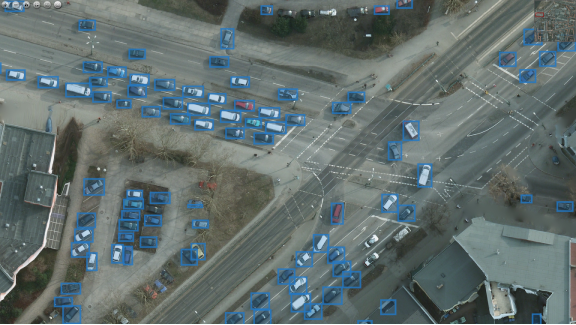
- Bounding boxes are rectangles drawn around objects of interest in an image. These boxes are used to annotate the location and extent of the objects in the data. Bounding boxes are used in object detection projects. You can draw bounding boxes around objects in an image and assign a class label to each box.
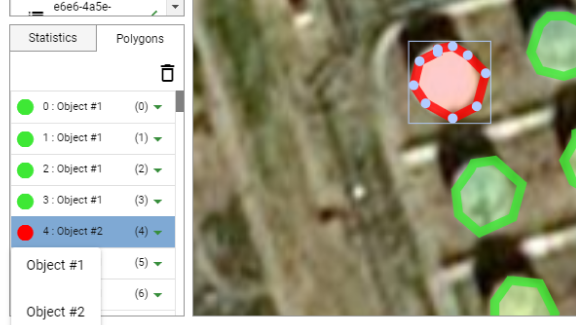
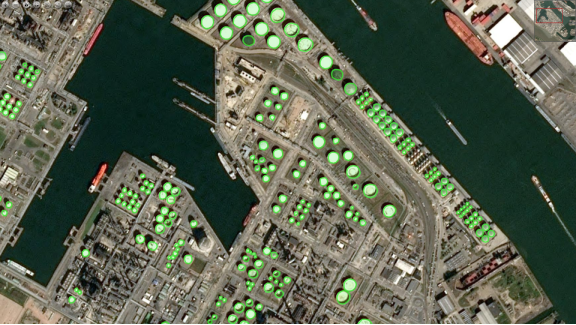
- Polygons are shapes defined by multiple points in an image. Unlike bounding boxes, which are typically represented by rectangles, polygon shapes can be more complex and can be used to annotate the shape of an object with greater accuracy. Polygons are used in image segmentation projects. You can draw polygon shapes around objects or areas in an image to define their exact boundaries and assign class labels to each polygon.
Deep Block's labeling tool
Deep Block's labeling tool is available in the Project view of image segmentation and object detection projects.
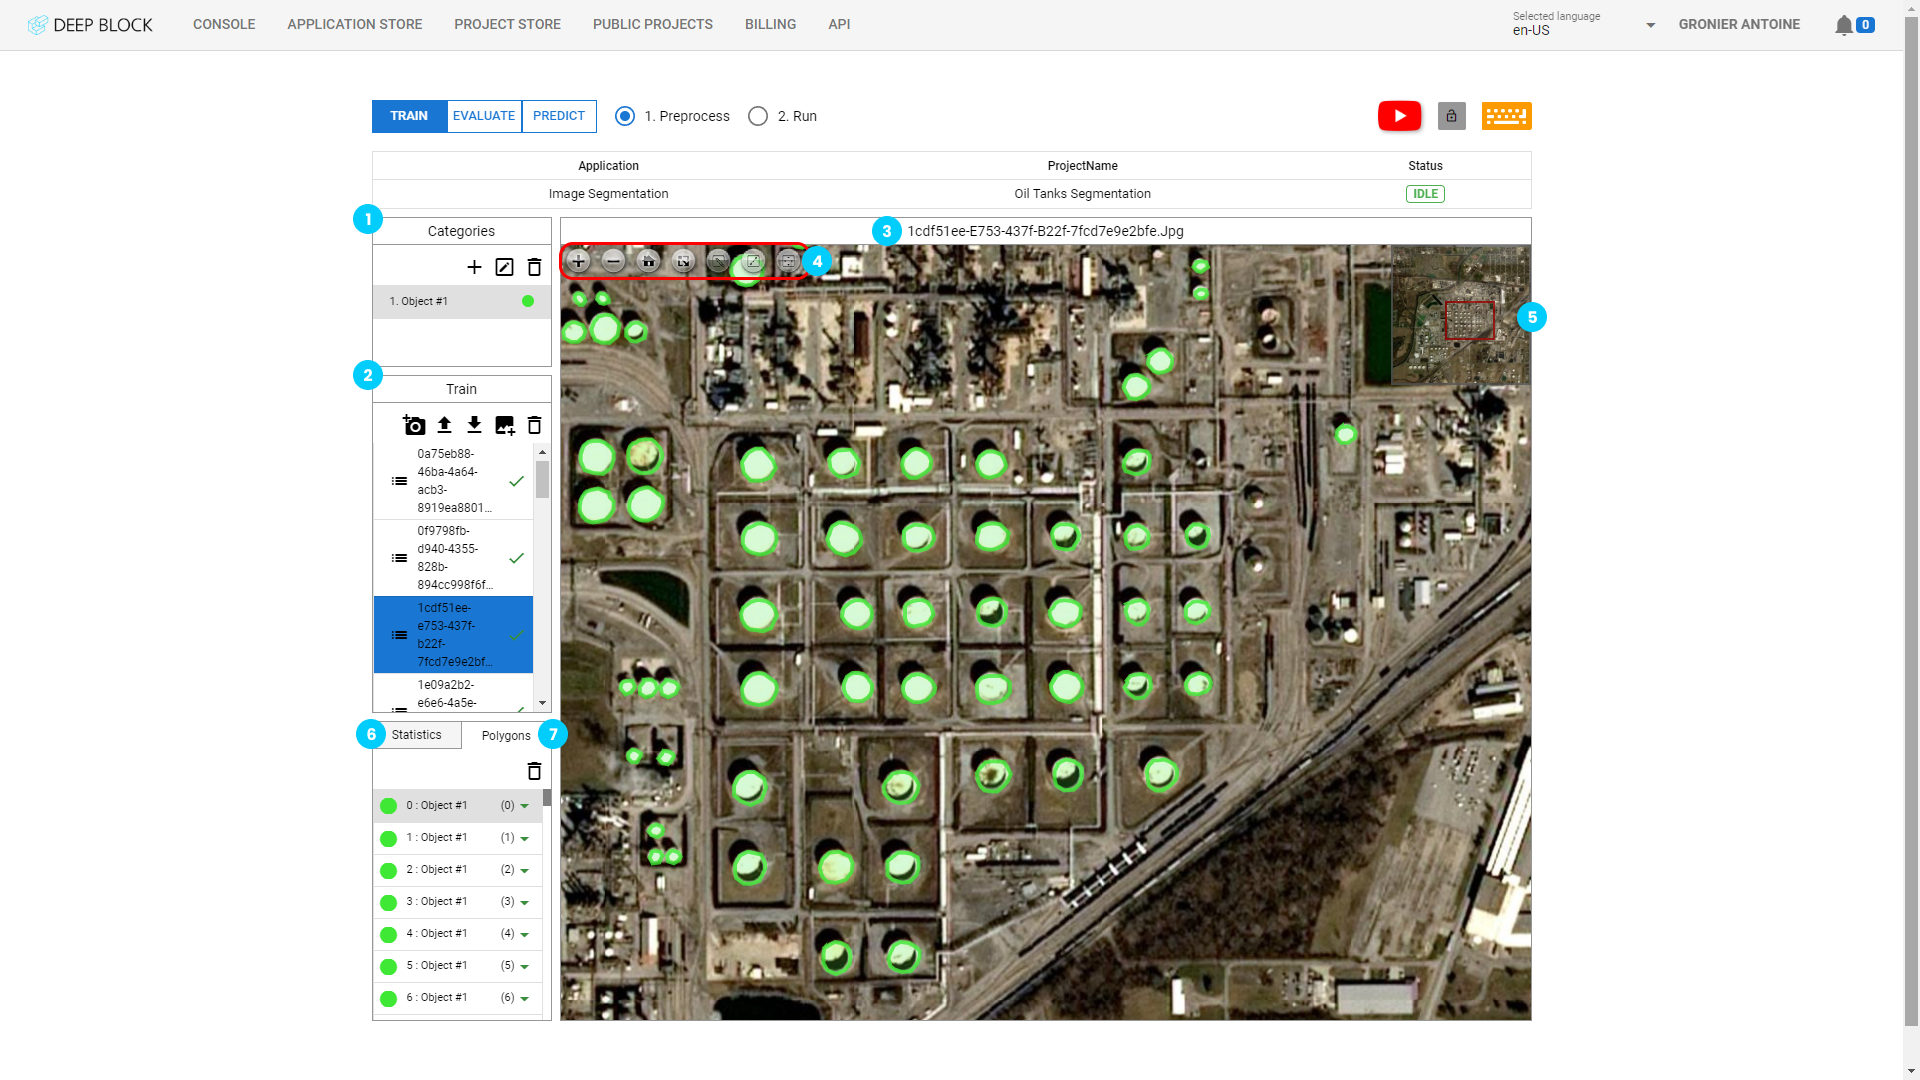
Object categories are available in the Categories panel.
Object categories or classes refer to the different types of objects that can appear in an image. Object classes are used to label objects of interest in the annotated data, and the labels are used by machine learning models to learn about the objects and to perform the tasks they are set for.
The set of object categories used in data labeling can vary depending on the task and the domain, and new categories can be added as needed. It is important to choose a set of object classes that is comprehensive and covers the objects of interest for the task at hand. The quality and accuracy of the annotated data and the performance of the trained models depend on the choice of object categories, so it is important to consider this carefully.
- Click on "
 " to add a category.
 - Click on "
 " to rename a category after selecting one. This option is also available by clicking right on the desired category.
 - Click on "
 " to remove a category after selecting one. This option is also available by clicking right on the desired category.
Caution: Removing a category will remove every labeled data belonging to that category. - Click on the colored "
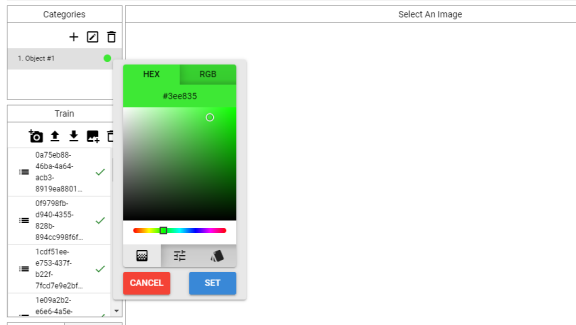
 " to display the Categories color panel. You can choose your preferred color using HEX or RBG values, or directly by selecting the color of your choice.
The training dataset you wish to use will be displayed in the Train panel.
A dataset in data labeling refers to a collection of images that have been annotated with labels or annotations. Images are curated from a variety of open or commercial sources (from satellites, drones, microscopes, and from any type of sensor).
In data labeling, the annotated data is usually divided into two parts: a training set and a validation set. The training set is used to train the machine learning model, and the validation set is used to evaluate its performance. The validation set is used to evaluate model performance and to avoid overfitting, which occurs when the model is too closely fit to the training data and performs poorly on new data.
The quality and size of the dataset are important factors in the performance of the trained machine learning models. Large datasets with high-quality annotations can lead to better-performing models, while small or poorly annotated datasets can result in models with poor performance.
It is important to carefully curate the dataset to ensure that it meets the requirements of the task and the data.
- Click on "
 " to add an image via your webcam.
 - Click on "
 " to upload a JSON File. JSON files are often used to store the annotations or labels for the images.
 - Click on "
 " to download the JSON file for the current project.
 - Click on "
 " to import images that you wish to label.
 - Click on "
 " to remove an image after selecting it.
Image file formats supported are: png, jpg, webp, tiff, bmp, geotiff, and jp2 (10GB max for free users).
JSON file format supported: COCO JSON
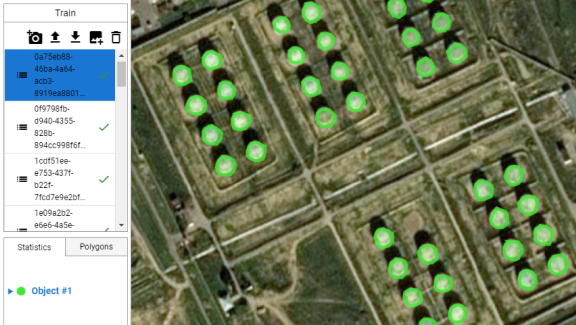
The image panel is where you can find the image you wish to label, the labeling tool box and the mini-map.
- Select an image in the Train panel to display it in the Image panel.
The labeling toolbox is a set of tools that helps you navigate and annotate all your images with ease. It can be found at the top-left corner of the Image panel.
- Click on "
 " to zoom in on the picture.
 - Click on "
 " to zoom out of the picture.
 - Click on "
 " to reset the view.
 - Click on "
 " to toggle the full-screen mode.
 - Click on "
 " to toggle the draw mode.
 - Click on "
 " to toggle the select mode.
 - Click on "
 " to toggle the move mode.
Quick Tips
Toggle the full-screen view to immerse better in the data labeling.
You can also use hotkeys to facilitate the work.
- 1-9: press any number on your keypad to select the corresponding category. This helps easily switch categories during labeling. Select a polygon or a bounding box and press any number to switch its current category to the corresponding category.
- Space bar: switch to Move mode
- Crtl: switch to Draw mode
- S: switch to Select mode
- Delete: delete the current image. Select a polygon or a bounding box and press Delete to remove it.
- ↑: switch to the previous image in the list
- ↓: switch to the next image in the list
- →: move the image to the right
- ←: move the image to the left
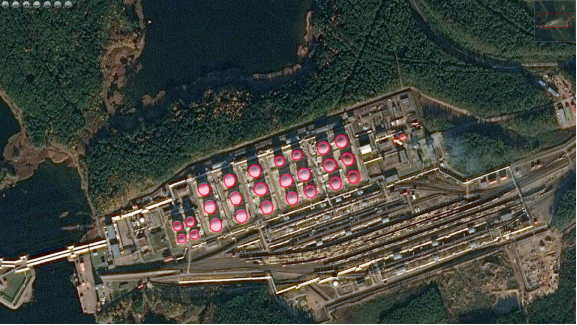
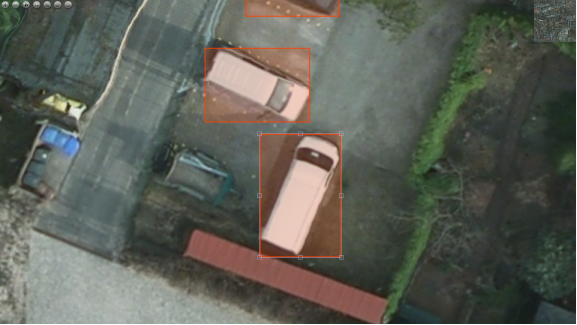
For object detection projects only: use the Draw mode to create bounding boxes around the desired objects. The angle of the box does not really matters as long as you keep all the corners of the object within the boundaries of the box.
Once your bounding box is created, you can resize it using the Select mode. Correct the position of the corner pins to your liking until the object properly fits within the box.
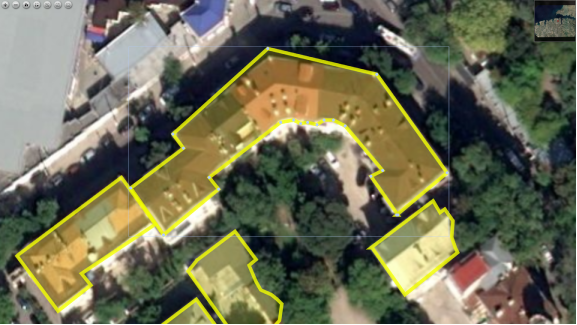
For image segmentation projects only: use the Draw mode to create polygons following the contours of the desired objects or area. The drawing must be as precise as possible to improve your model performance.
Once your bounding box is created, you can move each of its individual anchor points using the Select mode. Correct the position of the anchors to your liking until the borders of the polygons align with the borders of the object or area.
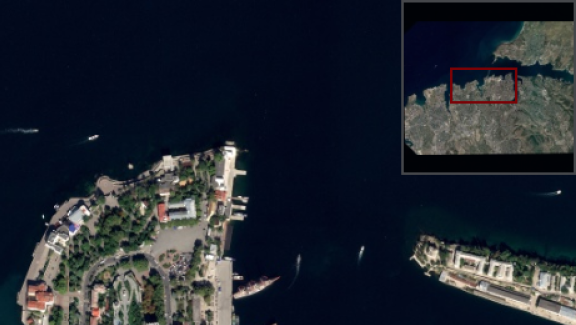
The Mini-map is a small, simplified representation of the image that the annotator is labeling. It provides an overhead view and a visual overview of the surrounding area, making it easier to understand the location of the annotator within the image. The annotator view is dynamically represented by a red rectangle.
The Statistics tab indicates, per category, the number of polygons or bounding boxes within the Project dataset or in the selected image.
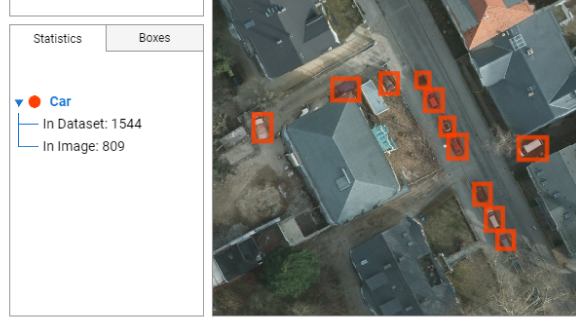
The Polygons or Boxes tab lists each object or area labeled within the selected image. Each annotation of this list can be individually selected to display its current position on the image.
- Click "
 " after selecting an annotation in the list to remove the annotation.
Caution: this process can not be undone. - Click on the "
 " or click right on each annotation in the list to switch its category.
